Slow Query Diagnosis
You can’t optimize what you can’t measure
Slow queries are the arch-enemy of online business databases. Knowing how to diagnose and locate slow queries is an essential skill for DBAs.
This article introduces a general methodology for diagnosing slow queries using Pigsty, a monitoring system.
The Impact of Slow Queries
For PostgreSQL databases serving online business transactions, slow queries can cause several problems:
- Slow queries consume database connections, leaving no connections available for normal queries, leading to query pileup and potential database meltdown.
- Slow queries can lock old tuple versions that have been cleaned up on the primary, causing replication replay processes to stall and leading to replication lag.
- The slower the query, the higher the chance of deadlocks, lock waits, and transaction conflicts.
- Slow queries waste system resources and increase system load.
Therefore, a competent DBA must know how to quickly identify and address slow queries.
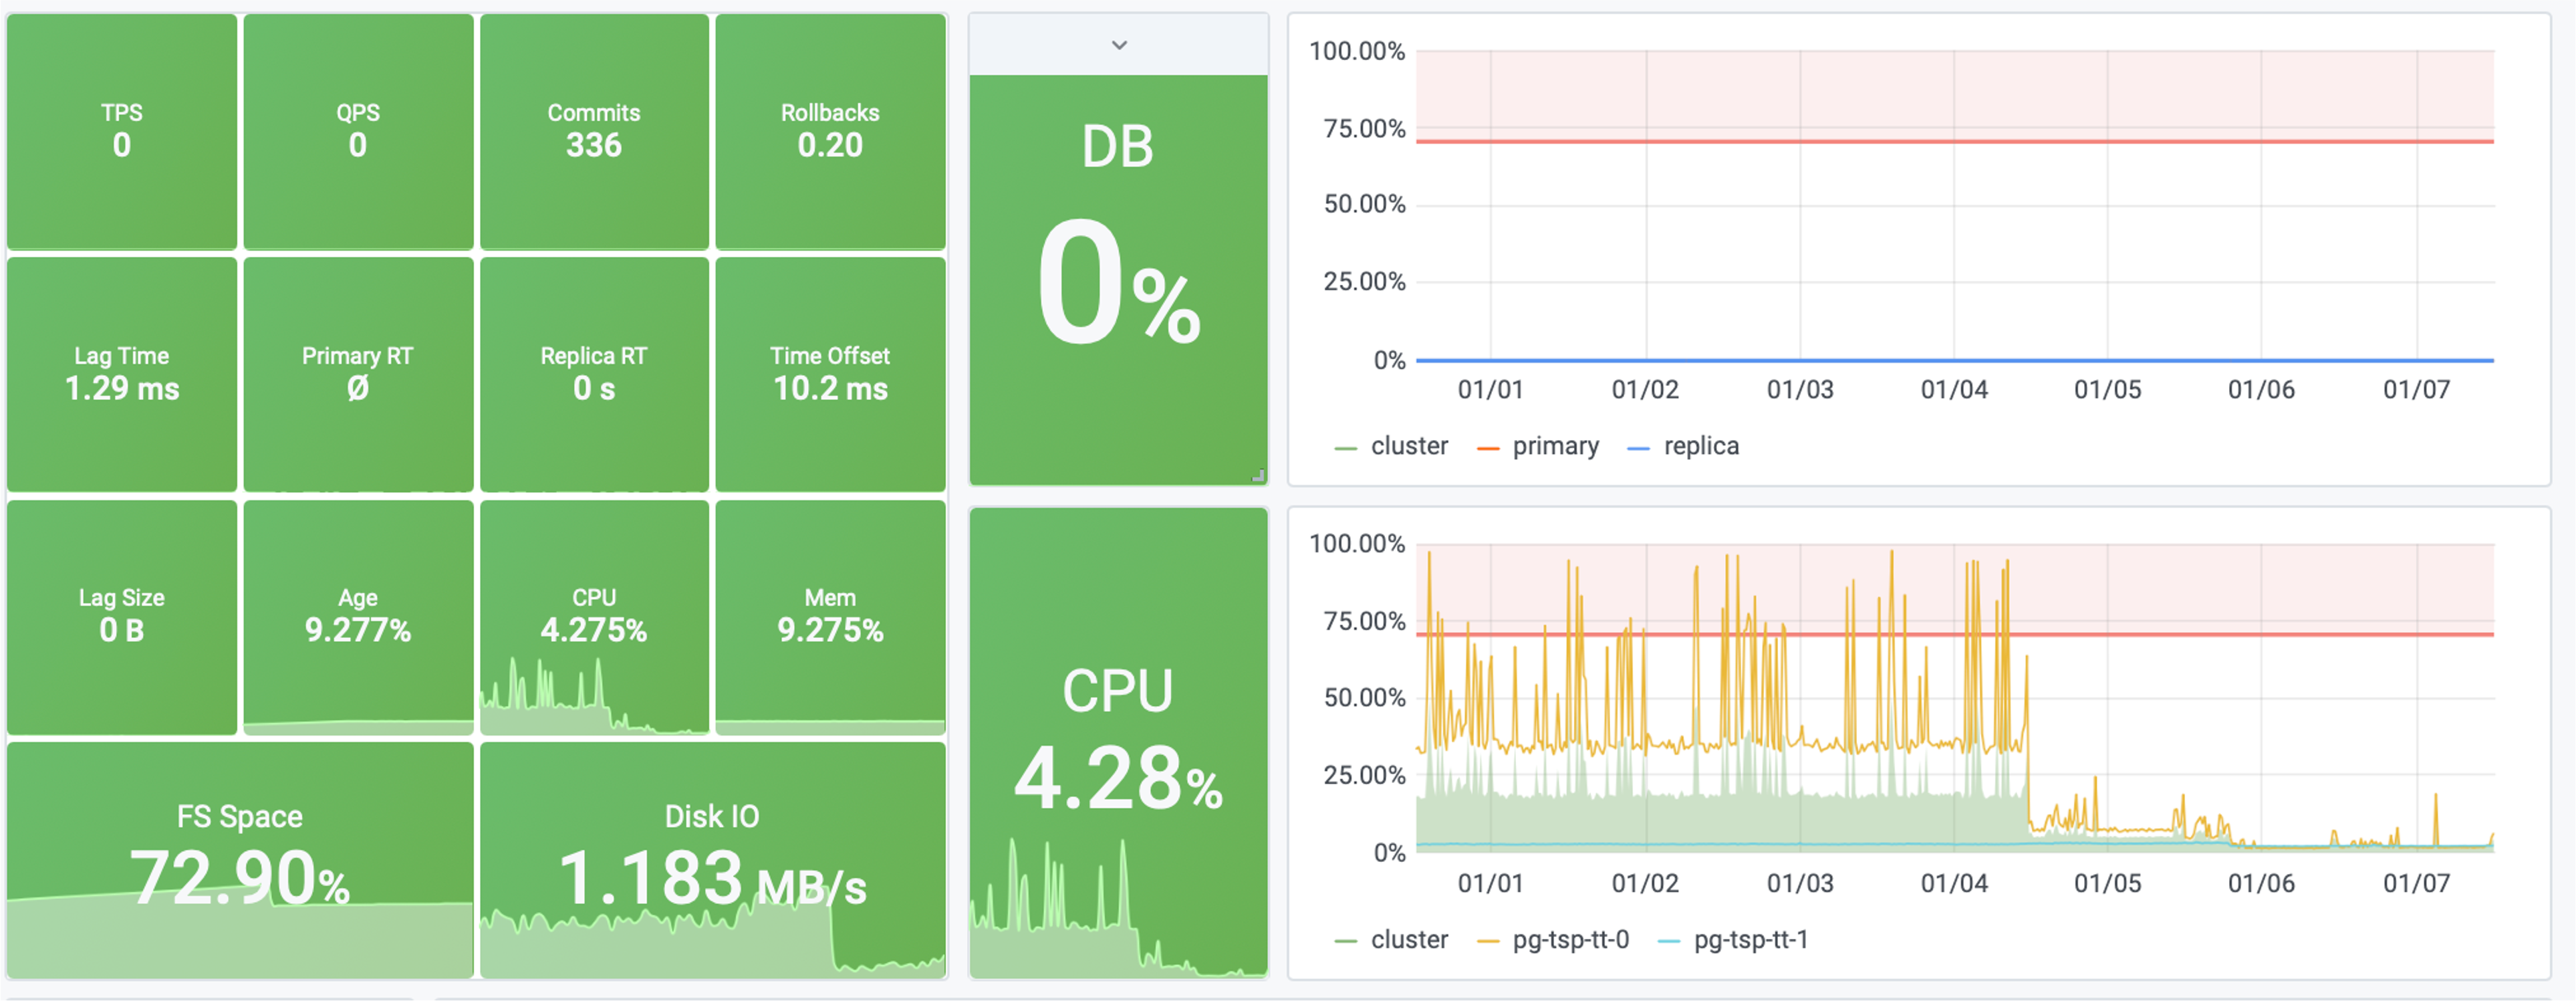
Figure: After optimizing a slow query, system saturation dropped from 40% to 4%
Traditional Methods for Slow Query Diagnosis
Traditionally, there are two ways to obtain information about slow queries in PostgreSQL: the official extension pg_stat_statements and slow query logs.
Slow query logs, as the name suggests, record all queries that take longer than the log_min_duration_statement parameter. They are indispensable for analyzing specific cases and one-off slow queries. However, slow query logs have limitations. In production environments, for performance reasons, we typically only log queries exceeding a certain threshold, which means we miss out on a lot of information. That said, despite the overhead, full query logging remains the ultimate weapon for slow query analysis.
The more commonly used tool for slow query diagnosis is pg_stat_statements. This is an extremely useful extension that collects statistical information about queries running in the database. It’s strongly recommended to enable this extension in all scenarios.
pg_stat_statements provides raw metrics in the form of a system view. Each query type (queries with the same execution plan after variable extraction) is assigned a query ID, followed by metrics like call count, total time, max/min/average execution time, standard deviation of response time, average rows returned per call, and time spent on block I/O.
A simple approach is to look at metrics like mean_time/max_time. From the system catalog, you can indeed see the historical average response time for a query type. For identifying slow queries, this might be sufficient. However, these metrics are just a static snapshot of the system at the current moment, so they can only answer limited questions. For example, if you want to see whether a query’s performance has improved after adding a new index, this approach would be cumbersome.
pg_stat_statements needs to be specified in shared_preload_library and explicitly created in the database using CREATE EXTENSION pg_stat_statements. After creating the extension, you can access query statistics through the pg_stat_statements view.
Defining Slow Queries
How slow is too slow?
This depends on the business and the actual query type - there’s no universal standard.
As a rule of thumb:
- For frequent CRUD point queries, anything over 1ms can be considered slow.
- For occasional one-off queries, typically anything over 100ms or 1s can be considered slow.
Slow Query Diagnosis with Pigsty
A monitoring system can provide more comprehensive answers about slow queries. The data in a monitoring system consists of countless historical snapshots (e.g., sampled every 5 seconds). This allows users to look back at any point in time and examine changes in average query response times across different periods.

The above image shows the interface provided by Pigsty’s PG Query Detail, displaying detailed information about a single query.
This is a typical slow query with an average response time of several seconds. After adding an index, as shown in the Query RT dashboard on the right, the query’s average response time dropped from seconds to milliseconds.
Users can leverage the insights provided by the monitoring system to quickly locate slow queries in the database, identify problems, and formulate hypotheses. More importantly, users can immediately examine detailed metrics at different levels for tables and queries, apply solutions, and get real-time feedback, which is extremely helpful for emergency troubleshooting.
Sometimes, the monitoring system serves not just to provide data and feedback, but also as a calming influence: imagine a slow query causing a production database meltdown. If management or clients don’t have a transparent way to see the current status, they might anxiously push for updates, further affecting problem resolution speed. The monitoring system can also serve as a basis for precise management. You can confidently use monitoring metrics to demonstrate improvements to management and clients.
A Simulated Slow Query Case Study
Talk is cheap, show me the code
Assuming you have a Pigsty Sandbox Demo Environment, we’ll use it to demonstrate the process of locating and handling slow queries.
Simulating Slow Queries
Since we don’t have an actual business system, we’ll simulate slow queries in a simple and quick way using pgbench’s TPC-B-like scenario.
Using make ri / make ro / make rw, initialize pgbench test cases on the pg-test cluster and apply read-write load:
# 50TPS write load
while true; do pgbench -nv -P1 -c20 --rate=50 -T10 postgres://test:test@pg-test:5433/test; done

# 1000TPS read-only load
while true; do pgbench -nv -P1 -c40 --select-only --rate=1000 -T10 postgres://test:test@pg-test:5434/test; done
Now that we have a simulated business system running, let’s simulate a slow query scenario in a straightforward way. On the primary node of the pg-test cluster, execute the following command to drop the primary key from the pgbench_accounts table:
ALTER TABLE pgbench_accounts DROP CONSTRAINT pgbench_accounts_pkey;
This command removes the primary key from the pgbench_accounts table, causing related queries to switch from index scans to sequential full table scans, turning them all into slow queries. Visit PG Instance ➡️ Query ➡️ QPS to see the results:
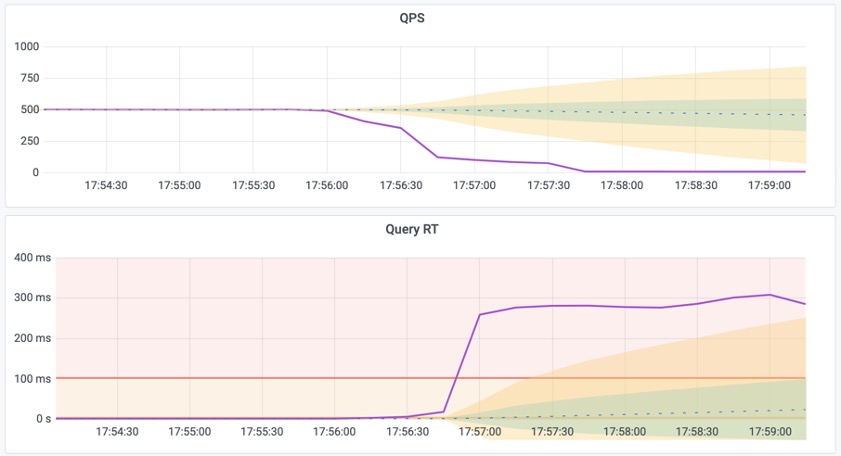
Figure 1: Average query response time spikes from 1ms to 300ms, and QPS on a single replica instance drops from 500 to 7.
Meanwhile, the instance becomes overloaded due to slow query pileup. Visit the PG Cluster homepage to see the cluster load spike:
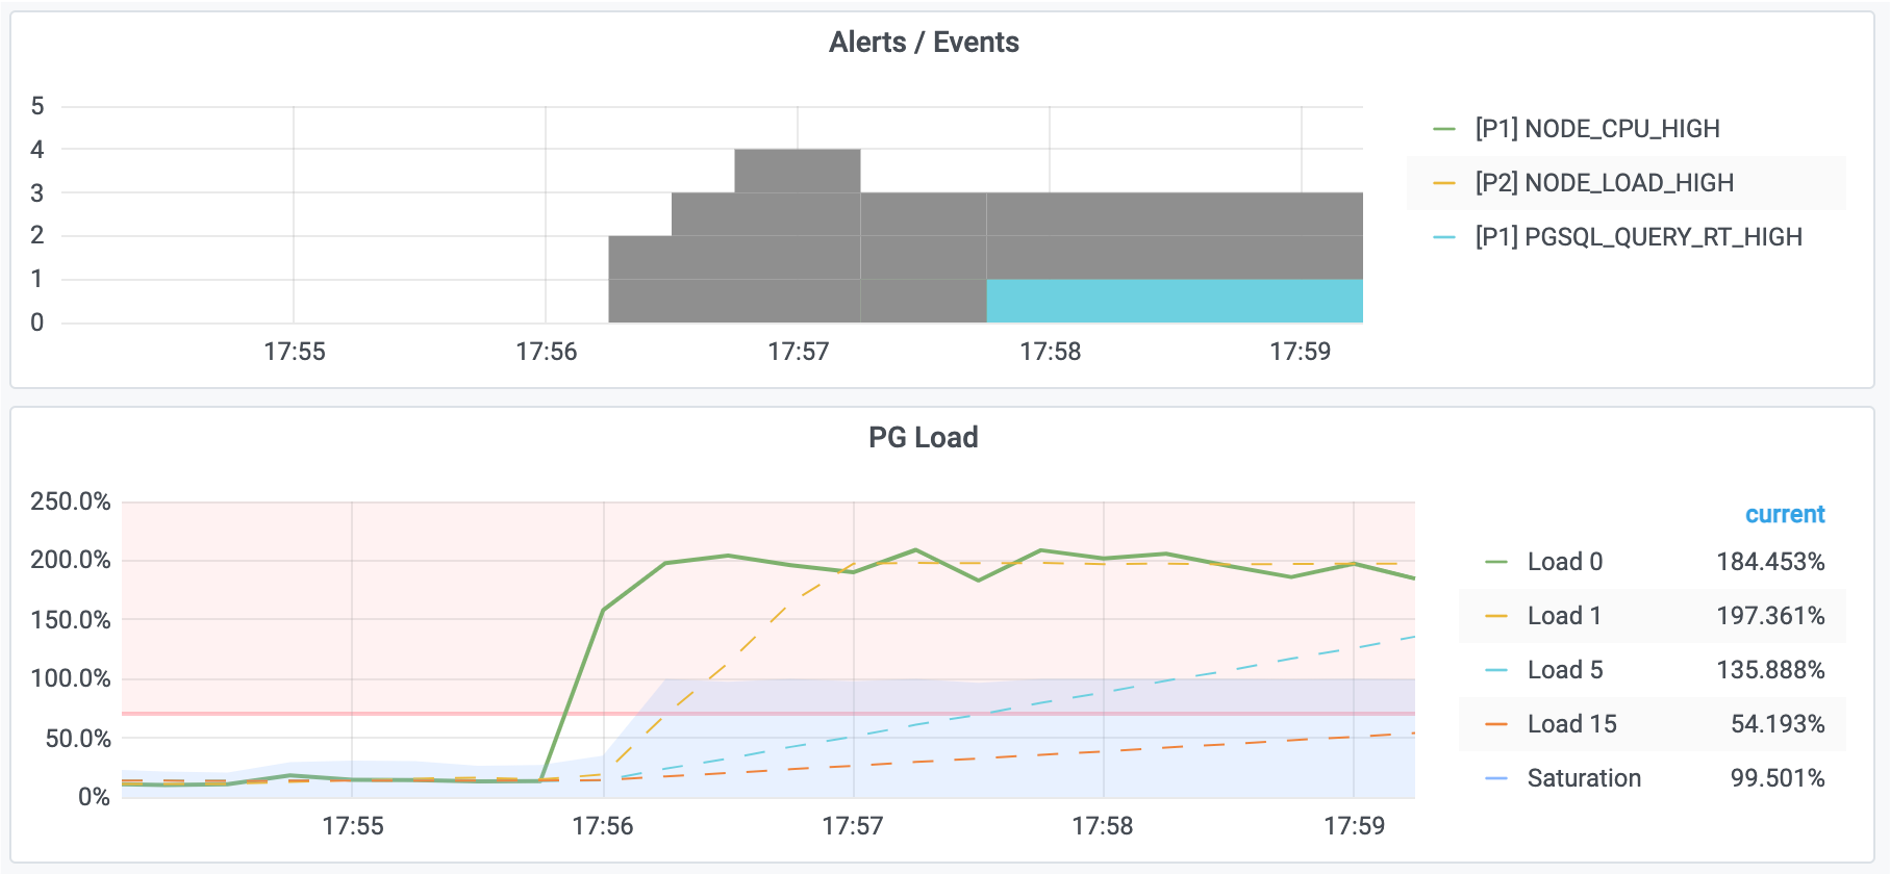
Figure 2: System load reaches 200%, triggering alerts for high machine load and excessive query response time.
Locating Slow Queries
First, use the PG Cluster panel to locate the specific instance with slow queries, in this case pg-test-2.
Then, use the PG Query panel to locate the specific slow query: ID -6041100154778468427
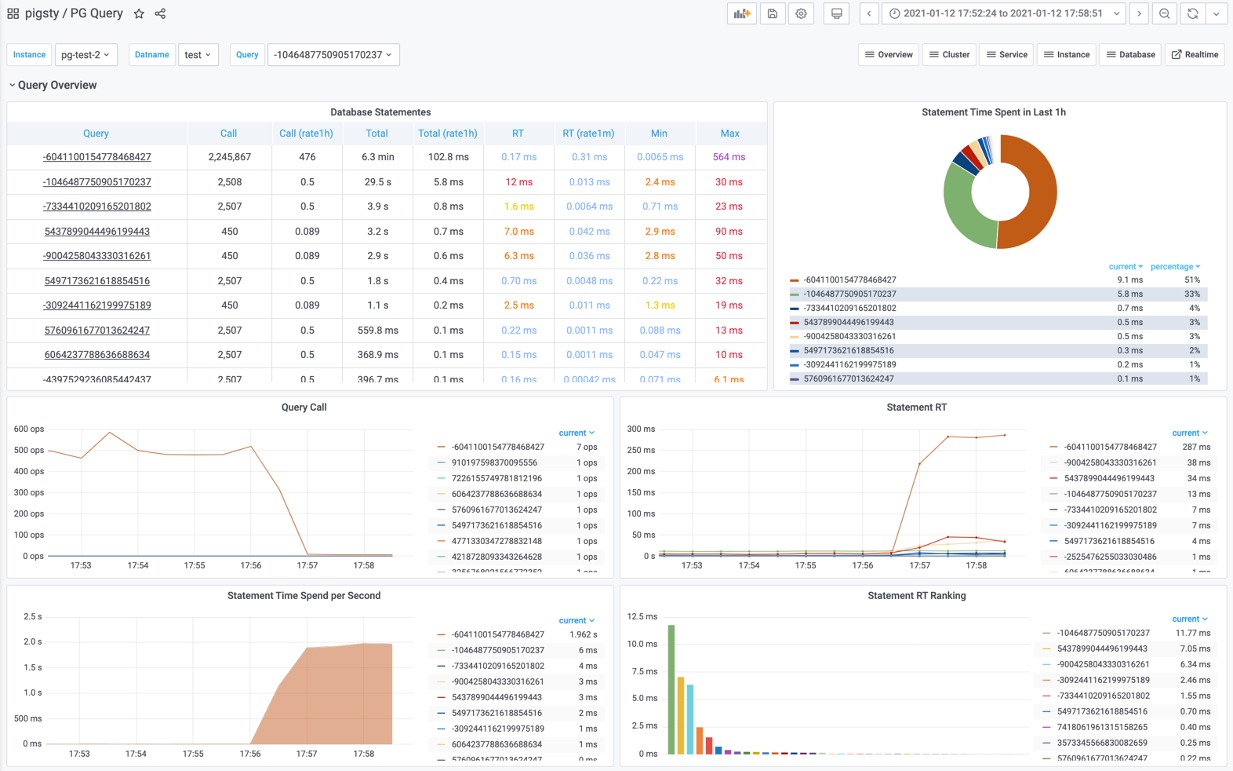
Figure 3: Identifying an abnormal slow query from the query overview
This query shows:
- Significant increase in response time: from 17us to 280ms
- Significant drop in QPS: from 500 to 7
- Significant increase in time spent on this query
We can confirm this is the slow query!
Next, use the PG Stat Statements panel or PG Query Detail to locate the specific statement of the slow query using the query ID.

Figure 4: Identifying the query statement as
SELECT abalance FROM pgbench_accounts WHERE aid = $1
Formulating Hypotheses
After identifying the slow query statement, we need to infer the cause of the slowness.
SELECT abalance FROM pgbench_accounts WHERE aid = $1
This query filters the pgbench_accounts table using aid as the condition. For such a simple query to slow down, it’s likely an issue with the table’s indexes. It’s obvious that we’re missing an index - after all, we just deleted it!
After analyzing the query, we can formulate a hypothesis: The query is slow because the aid column in the pgbench_accounts table is missing an index.
Next, we need to verify our hypothesis.
First, use the PG Table Catalog to examine table details, such as indexes on the table.
Second, check the PG Table Detail panel to examine access patterns on the pgbench_accounts table to verify our hypothesis:
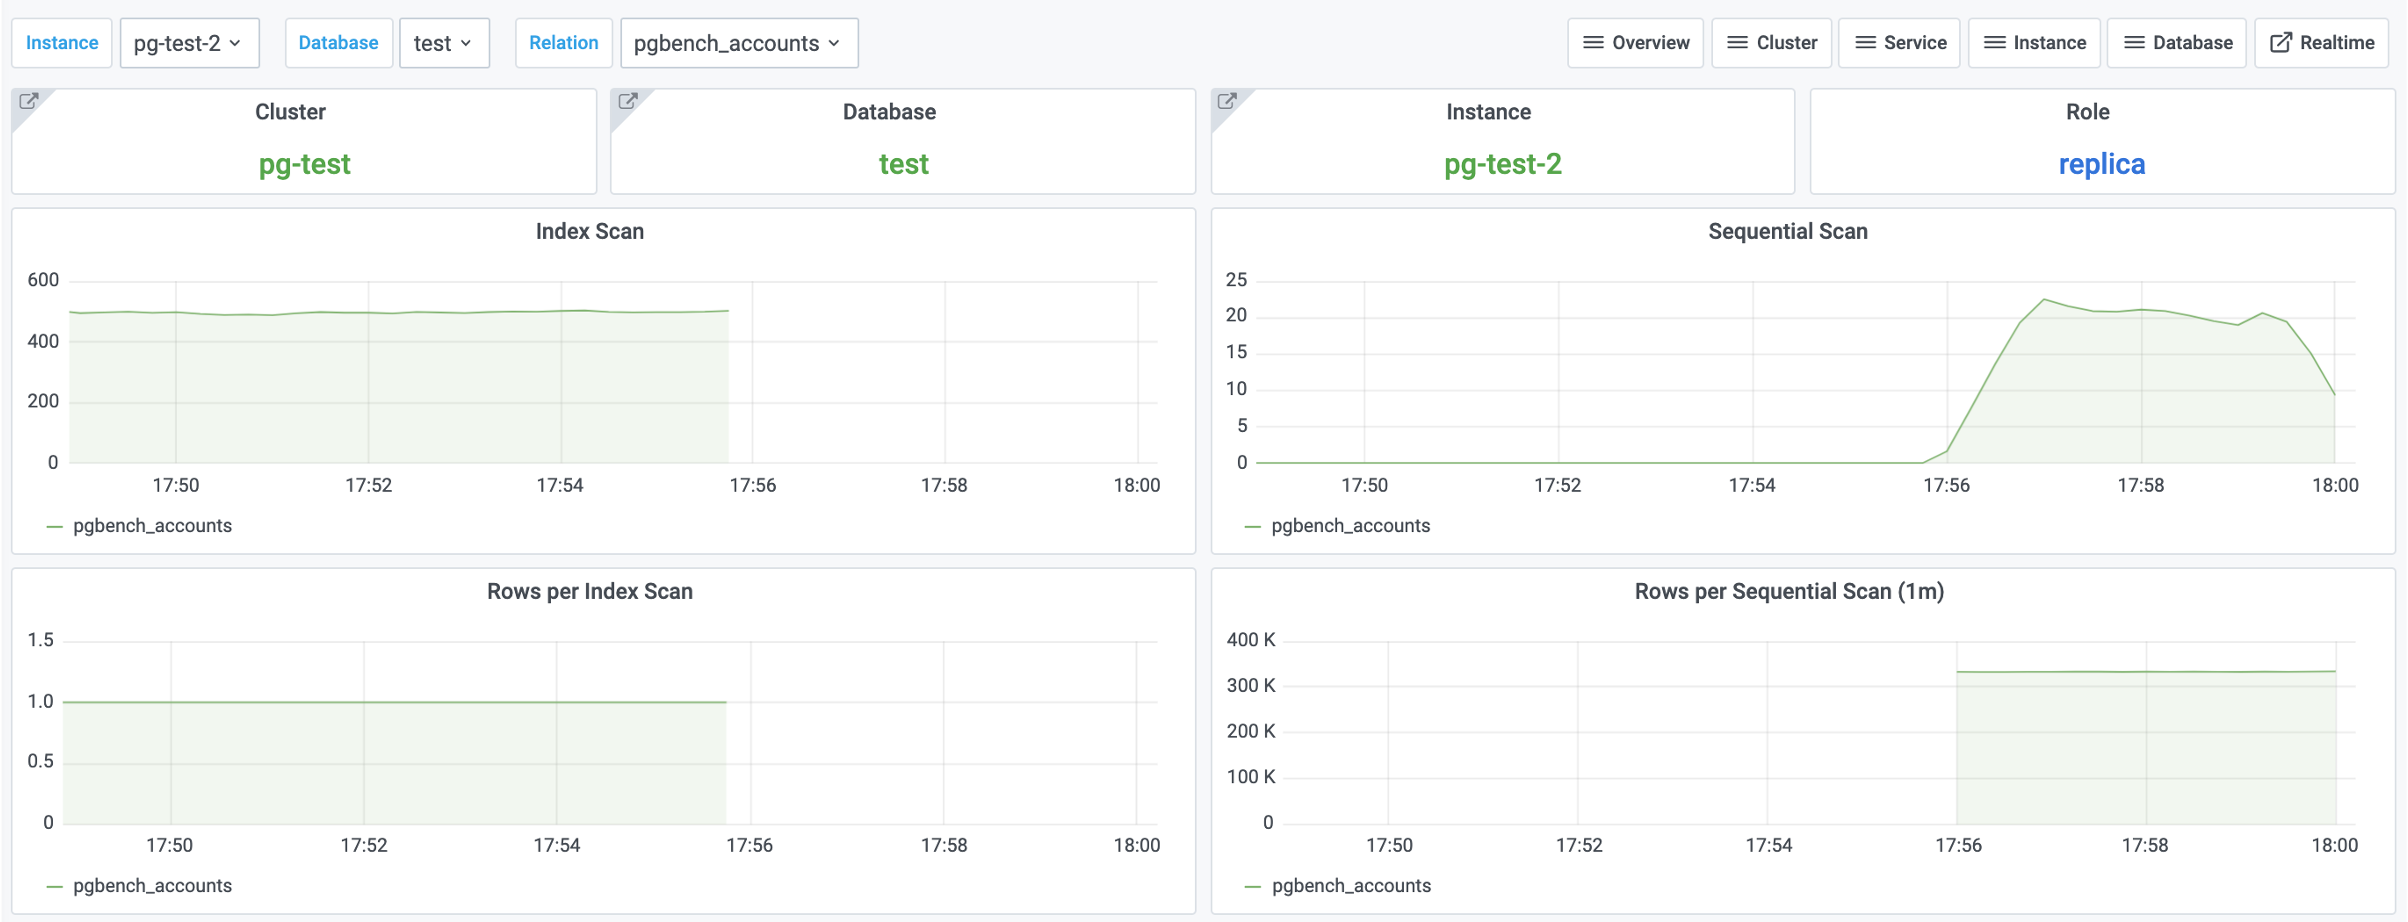
Figure 5: Access patterns on the
pgbench_accountstable
We observe that index scans have dropped to zero, while sequential scans have increased accordingly. This confirms our hypothesis!
Implementing Solutions
Once our hypothesis is confirmed, we can proceed with implementing a solution.
There are typically three ways to solve slow queries: modify table structure, modify queries, or modify indexes.
Modifying table structure and queries usually requires specific business and domain knowledge, requiring case-by-case analysis. However, modifying indexes typically doesn’t require much specific business knowledge.
In this case, we can solve the problem by adding an index. The pgbench_accounts table is missing an index on the aid column, so let’s try adding an index to see if it resolves the issue:
CREATE UNIQUE INDEX ON pgbench_accounts (aid);
After adding the index, something magical happens:
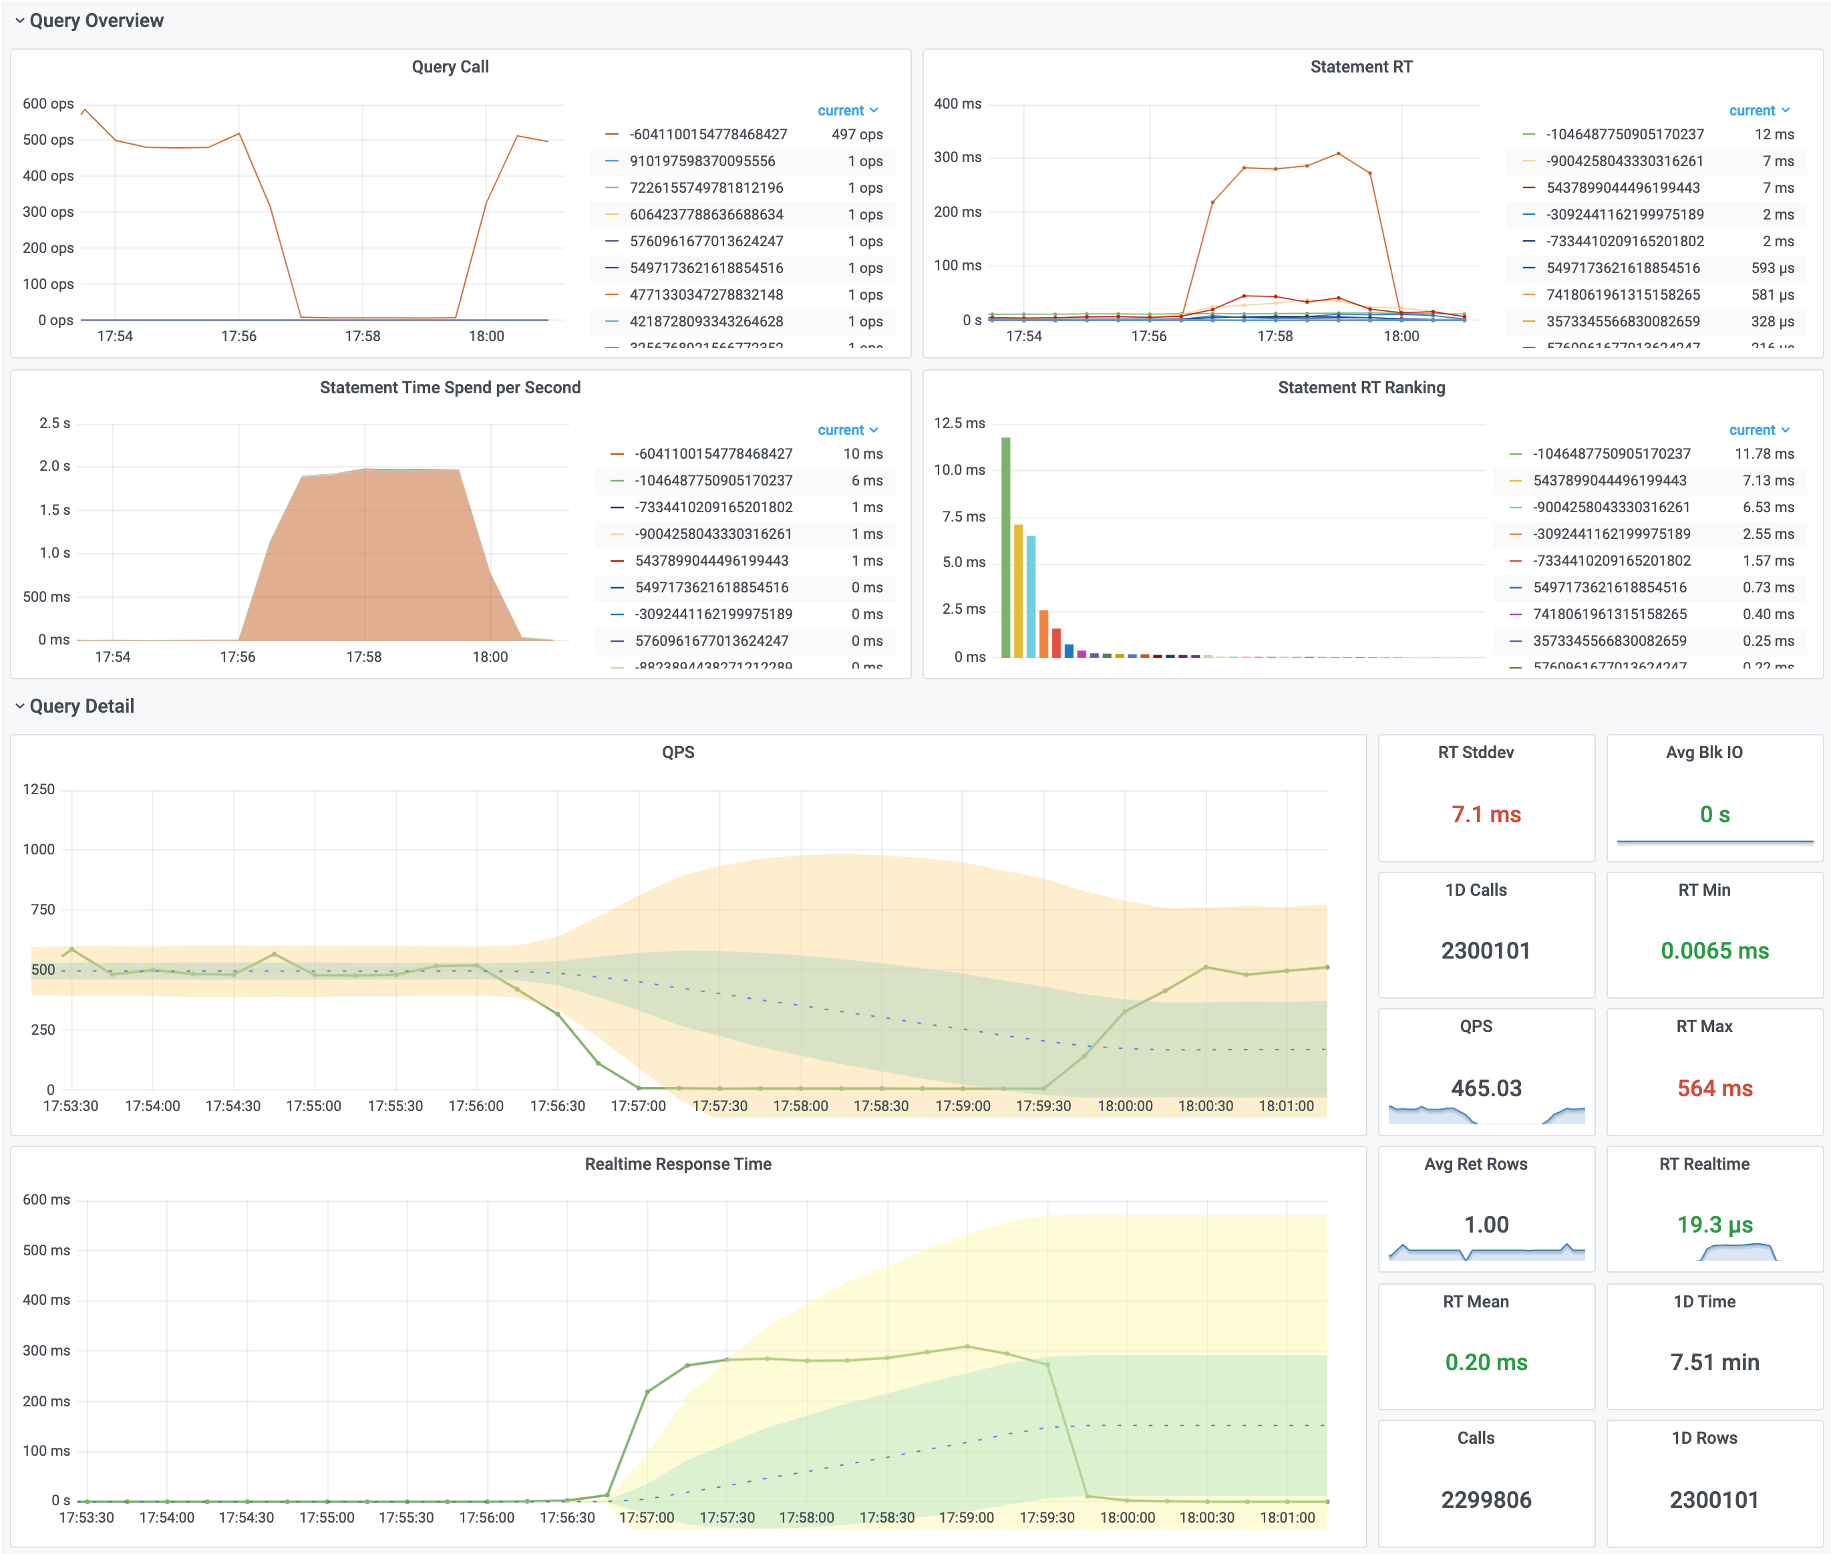
Figure 6: Query response time and QPS have returned to normal.
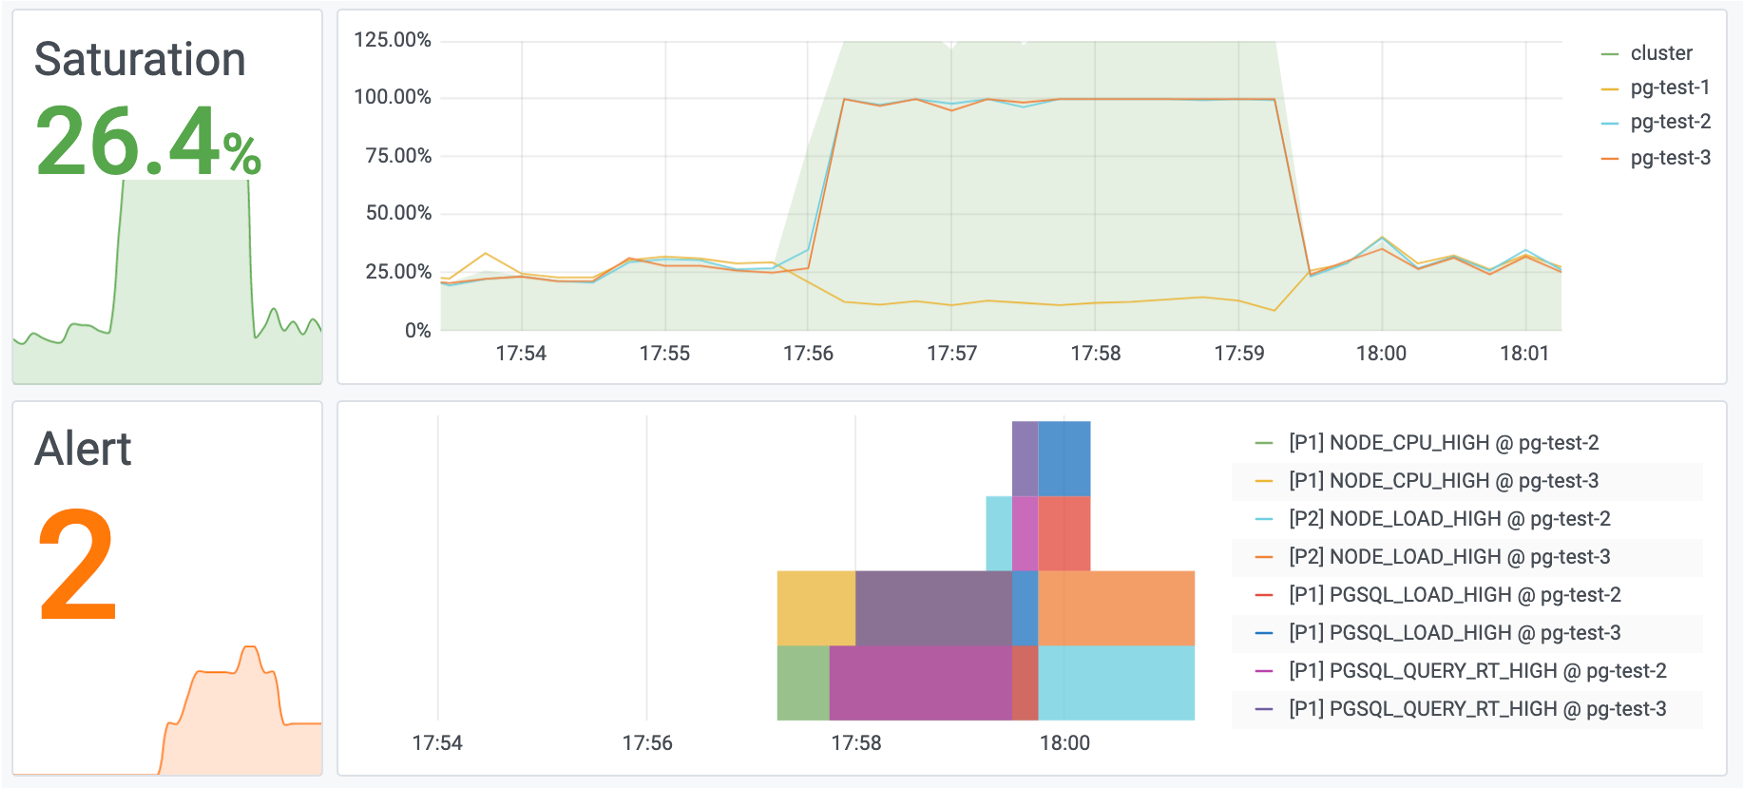
Figure 7: System load has also returned to normal.
Evaluating Results
As the final step in handling slow queries, we typically need to document the process and evaluate the results.
Sometimes a simple optimization can have dramatic effects. What might have required spending hundreds of thousands on additional machines can be solved by creating a single index.
These kinds of stories can be vividly demonstrated through monitoring systems, helping you earn KPI and credit.

Figure: Before and after optimizing a slow query, overall system saturation dropped from 40% to 4%
(Equivalent to saving X machines and XX dollars - your boss will be thrilled, and you’ll be the next CTO!)
Summary
Through this tutorial, you’ve learned the general methodology for slow query optimization:
- Locate the problem
- Formulate hypotheses
- Verify assumptions
- Implement solutions
- Evaluate results
The monitoring system plays a crucial role throughout the entire slow query handling lifecycle. It also helps express the “experience” and “results” of operations and DBAs in a visual, quantifiable, and reproducible way.